Page 1 of 1
Just a chart
Posted: Thu, 18 Jun 2015 20:20:41
by kelu
Re: Just a chart
Posted: Fri, 19 Jun 2015 10:48:59
by skeeterss0
then they wonder why so many blacks and Hispanics are in our prisons.
Re: Just a chart
Posted: Fri, 19 Jun 2015 12:07:28
by Jeff82
I'm confused:
Are these the victims of homicide or the killers?
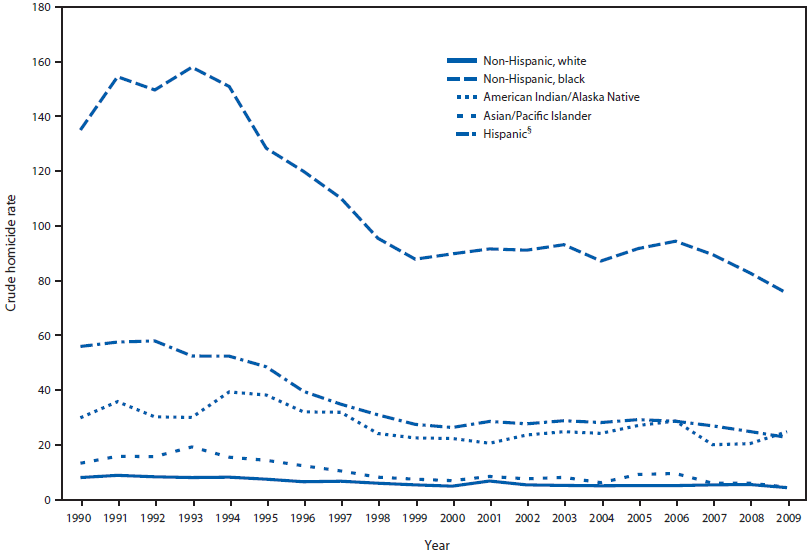
It reads, "FIGURE 2. Crude homicide rates* among males aged 15–29 years, by racial/ethnic group† and year — National Vital Statistics System, United States, 1990–2009
Alternate text: The figure shows crude homicide rates per 100,000 population among U.S. males aged 15-29 years, by racial/ethnic group and year for 1990-2009. Rates were lowest among non-Hispanic whites and highest among non-Hispanic blacks.
† Number of deaths per 100,000 population."
"Number of deaths" leads me to believe this figure represents victims within the group, not the rate of killers in the group.
Re: Just a chart
Posted: Fri, 19 Jun 2015 18:28:20
by kelu
These are death certificates that have homicide written on them.
Re: Just a chart
Posted: Fri, 19 Jun 2015 21:38:56
by grumpyMSG
Jeff82 wrote:I'm confused:
Are these the victims of homicide or the killers?
It reads, "FIGURE 2. Crude homicide rates* among males aged 15–29 years, by racial/ethnic group† and year — National Vital Statistics System, United States, 1990–2009
Alternate text: The figure shows crude homicide rates per 100,000 population among U.S. males aged 15-29 years, by racial/ethnic group and year for 1990-2009. Rates were lowest among non-Hispanic whites and highest among non-Hispanic blacks.
† Number of deaths per 100,000 population."
"Number of deaths" leads me to believe this figure represents victims within the group, not the rate of killers in the group.
That is the death rate. If you want the victim to killer numbers you can find some here:
https://www.fbi.gov/about-us/cjis/ucr/c ... r_2013.xls
With that you will find where most folks find 85% as a good estimate of the same race victim/killer. Whites were killed by other whites 83.5% of the time. Blacks were killed by blacks 90.1% of the time. Hispanics, which fall under a subcategory of whites, killed other hispanics 74.7% of the time. If you go with non-hispanics killing non-hispanics that figure is 88.4%. The monkey wrench in the whites/hispanics numbers comes from a large number of unknown ethnicities because not all agencies reported ethnicity data.
Re: Just a chart
Posted: Fri, 19 Jun 2015 21:48:56
by MarcSpaz
Sarg, I remember reading or hearing on TV that most victims know their killer. (too much Investigation Discovery) Since most people I know seem to associate with a demographic they are most closely a part of, all of those stats don't surprise me.
Of course, that is all speculation on my part, but based on my own life experience.
[ Post made via Mobile Device ]